
Every site speed tool hands you two categories of number and only one of them has anything to do with your Google ranking. What you get from a single click is lab data. What Google uses to assess page experience comes from your actual visitors.
To keep that from being just an assertion, we measured ten pages with one fixed method. Five of them currently rank in the top five for the Persian query that means "site speed test", four come from the results for "WordPress theme", and the tenth is our own homepage.
The method, precisely
Every number below is reproducible with these settings, one cold run per URL, all inside a few minutes on 15 August 2026, from a server in a datacentre:
lighthouse 12.8.2
Chrome for Testing 148.0.7778.96
--form-factor=mobile --screenEmulation.mobile
--throttling-method=simulate
--only-categories=performance
Ten pages
| Page | Score | LCP | TBT | CLS | Weight | Server response |
|---|---|---|---|---|---|---|
| rgb.ir | 99 | 2.0 s | 0 | 0 | 151 KiB | 30 ms |
| seo33.ir | 99 | 1.0 s | 100 ms | 0.013 | 348 KiB | 1490 ms |
| mihanwp.com/themes | 92 | 2.4 s | 0 | 0.137 | 655 KiB | 100 ms |
| mihanwp.com/website | 91 | 3.2 s | 130 ms | 0.012 | 4402 KiB | 90 ms |
| mizfa.tools | 77 | 2.9 s | 0 | 0.248 | 2436 KiB | 260 ms |
| portal.ir | 67 | 4.2 s | 600 ms | 0 | 1312 KiB | 510 ms |
| safine.net | 66 | 5.5 s | 0 | 0.004 | 460 KiB | 730 ms |
| rtl-theme.com | 65 | 11.2 s | 240 ms | 0.025 | 1852 KiB | 290 ms |
| parspack.com | 48 | 8.0 s | 870 ms | 0 | 2972 KiB | 1800 ms |
| zhaket.com | 35 | 9.0 s | 510 ms | 0.202 | 1813 KiB | 1330 ms |
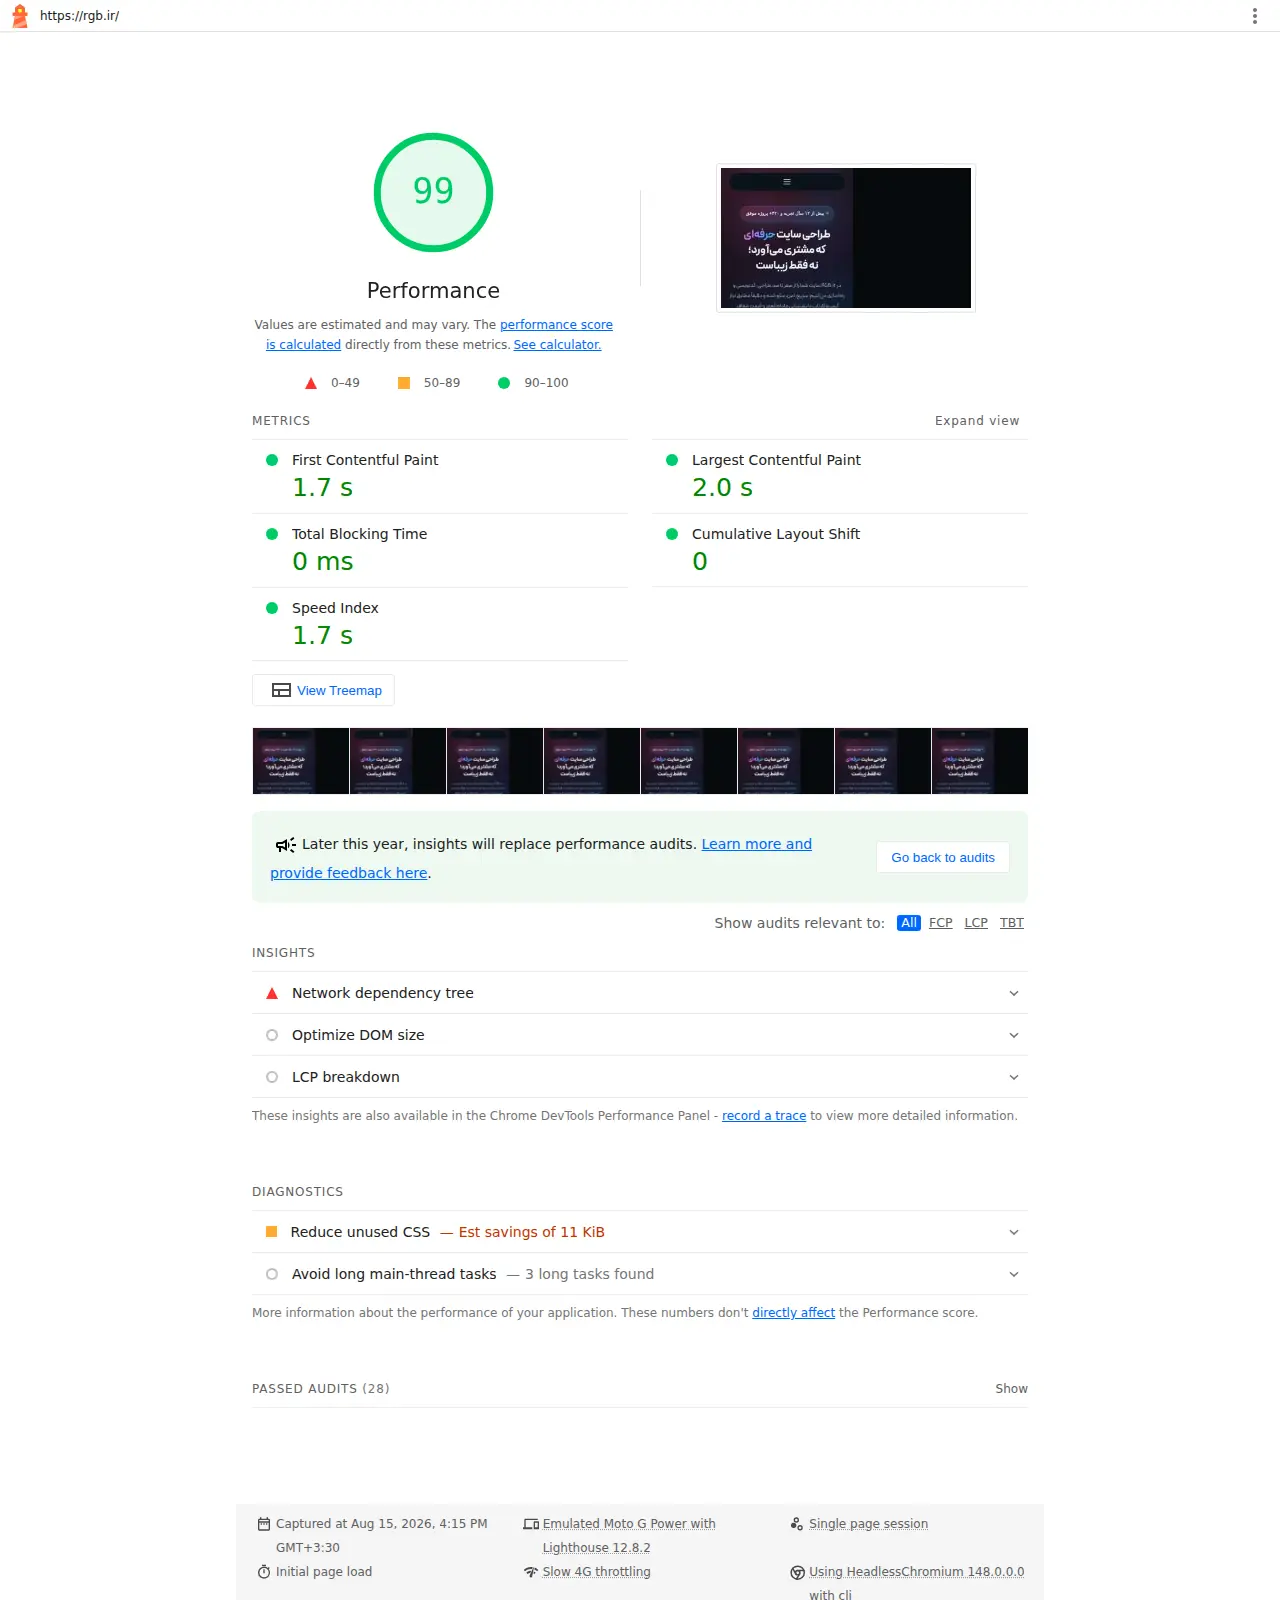
Two rows Lighthouse itself flagged
This belongs in the piece because the report says it. On two of the ten runs Lighthouse returned the warning that the page loaded too slowly to finish within the time limit and results may be incomplete: mizfa.tools and zhaket.com. Read 77 and 35 with that in mind. The direction is right, the precision is lower than the other eight. The remaining runs, ours included, carried no warning.
Reading the rest of the table
The first four Google results for that speed test query, the pages teaching people how to measure site speed, scored 66, 67, 48 and 77.
Two rows that break the obvious reading
Read the table top to bottom and you get a simple message that happens to be wrong. Look at two rows on their own instead.
seo33.ir scored 99 with a server response of 1490 ms. Its server started answering roughly a second and a half later than ours and it still took a full score, because the score is a weighted blend and a light page absorbs a slow server. That second and a half stays in the visitor's pocket regardless; the tool forgives it on its own scale, and the person waiting does not.
rtl-theme.com is the mirror image: an LCP of 11.2 seconds and a score of 65. Nothing went wrong in the measurement. LCP carries 25 percent of the total and the remaining metrics held the number up.
The practical conclusion is to use the score for comparing two versions of one page, never for judging a site. Look at LCP, INP and CLS separately.
Lab numbers and field numbers
All ten figures above are lab data, including our own 99. One run, from a server with a good connection, through a mobile emulation. That is excellent for diagnosis and useless for predicting rank.
Google assesses page experience on field data: the 75th percentile of your real visitors over the previous twenty eight days, split by mobile and desktop. If your site does not draw enough traffic to populate that dataset, you have no field data at all, and no tool will manufacture it for you.
| Tool | What it gives | When it earns its place |
|---|---|---|
| PageSpeed Insights | Both, when field data exists | The first look at any URL |
| Core Web Vitals report in Search Console | Field only, grouped | Finding which class of page is failing |
| Local Lighthouse | Lab only | Before and after one change |
| GTmetrix and similar | Lab only, from a location you choose | When the test location matters |
One caution about branded speed testers generally: most of them are a Lighthouse run wearing someone else's interface. That is fine, but do not expect field data from them and do not treat their number as interchangeable with PageSpeed, because the throttling settings are not the same.
How our own page reached 151 KiB
The lightest row is ours and nothing about the route was clever. CSS is injected into the HTML so no request blocks rendering, fonts are subset, and every animation, transition and backdrop filter was stripped from the whole site. That last decision is what took TBT to zero. One exception survived, on the desktop header only.
Did it cost some visual polish? A little. Zero TBT and zero CLS on mobile is not something a caching plugin delivers, though, because caching was never the constraint.
When testing your speed is a waste of an afternoon
If your LCP is 2.5 seconds and traffic is flat, speed is not your problem. Pulling it to 1.9 buys a green tick and almost no ranking, because page experience carries small weight next to how well the content matches the query.
Speed is worth spending on when the number is genuinely bad, like the bottom rows of this table, or when conversion rather than ranking is the goal. We say that while selling speed work, because selling a speed project to a site whose real problem is its content produces an unhappy client two months later.
Questions that come up after a test
What score should I aim for
The score is not the target. Read the three metrics separately: LCP under 2.5 seconds, INP under 200 milliseconds, CLS under 0.1. A site scoring 75 that clears all three is in better shape than one scoring 90 with broken CLS.
Why does the number change every time I run it
Because a lab run is sensitive to the state of the network and the load on the server at that moment. Run it three times, take the median, and always test from the same place.
My WordPress site is slow, where do I start
Page weight first, server response second. Look at the table again: every page above two megabytes in this set scored below eighty.
Where to go next
If you want to know exactly what the three core metrics measure, a plain explanation of LCP, INP and CLS is the right starting point. If your server response looks like the bottom two rows, the cause usually sits in how hosting configuration drives your speed numbers rather than in the theme.
And if your numbers really are bad and you want to know how much of it is fixable, speed work measured before and after starts from a table like this one rather than from a screenshot. For a site that does not exist yet, the cheapest way to these figures is building without the extra weight from day one, since making a heavy site light always costs more than building it light.
Sources
- The Web Vitals reference page for the thresholds and the definition of the 75th percentile
- How the Lighthouse performance score is calculated for the weight each metric carries
Everything was measured on 15 August 2026. Run the same URLs today and the numbers will differ, because pages change.


Comments & Questions
Have a question about this article? Ask, we'll answer.
No comments yet; be the first.